Analytics with an analyst built in
Your numbers,
with notes in the margin.
MetricMind collects traffic, performance and errors without cookies. Then a built-in AI analyst reads them for you. It explains what changed, shows the evidence, and suggests what to do next.
Free during beta. No card, no spam. · See a live demo →
- Visitors
- 6,412+18%
- Pageviews
- 9,874+24%
- Bounce
- 41%−6 pts
- LCP p75
- 1.8 sgood
Analyst note · This morning
Visitors jumped 2.4× on the 16th. 71% came from news.ycombinator.com and landed on /pricing. Signups held at 3.1%, so the traffic was qualified. Worth a follow-up post while it’s warm.
An analyst that never
stops reading.
Dashboards wait for you to notice. MetricMind’s analyst notices first, checks the obvious explanations, and only speaks up when a change is real.
01 · Notices
It spots what’s unusual
Every morning it compares yesterday with the same weekday and the week before. Normal weekday swings and changes on tiny numbers stay quiet.
02 · Checks
It checks before it speaks
Sources, pages, devices, errors, deploys and your timeline notes. It writes down what it ruled out, so you can see the reasoning.
- Sources71% from news.ycombinator.com
- Botsruled out: real browsers, real reading time
- Deploysnone that day
- Errorsno new errors
- Your notes“Launch post”, Oct 16
03 · Explains
It explains in plain words
What changed, by how much, and why it thinks so. Every number links to the query behind it, so you can check the work.
What happened on the 16th?
MetricMind: Visitors jumped 2.4×, mostly from Hacker News, landing on /pricing. Sign-ups held at 3.1%, so the traffic was qualified.
sources · 2026-10-16goals · sign-upEvery number links to its query04 · Suggests
It suggests the next step
An action, a question, or “keep watching”. When the next step is to measure something, it drafts the goal, funnel or alert. Nothing changes until you click.
Suggested alert
Contact clicks below 2 per day
A normal day has about 5. Fewer than 2 means something broke.
Create alertCreated · email and Slack
See it in action.
Open the live demo →The real dashboard and real analyst answers, on a demo marketplace with sample data.
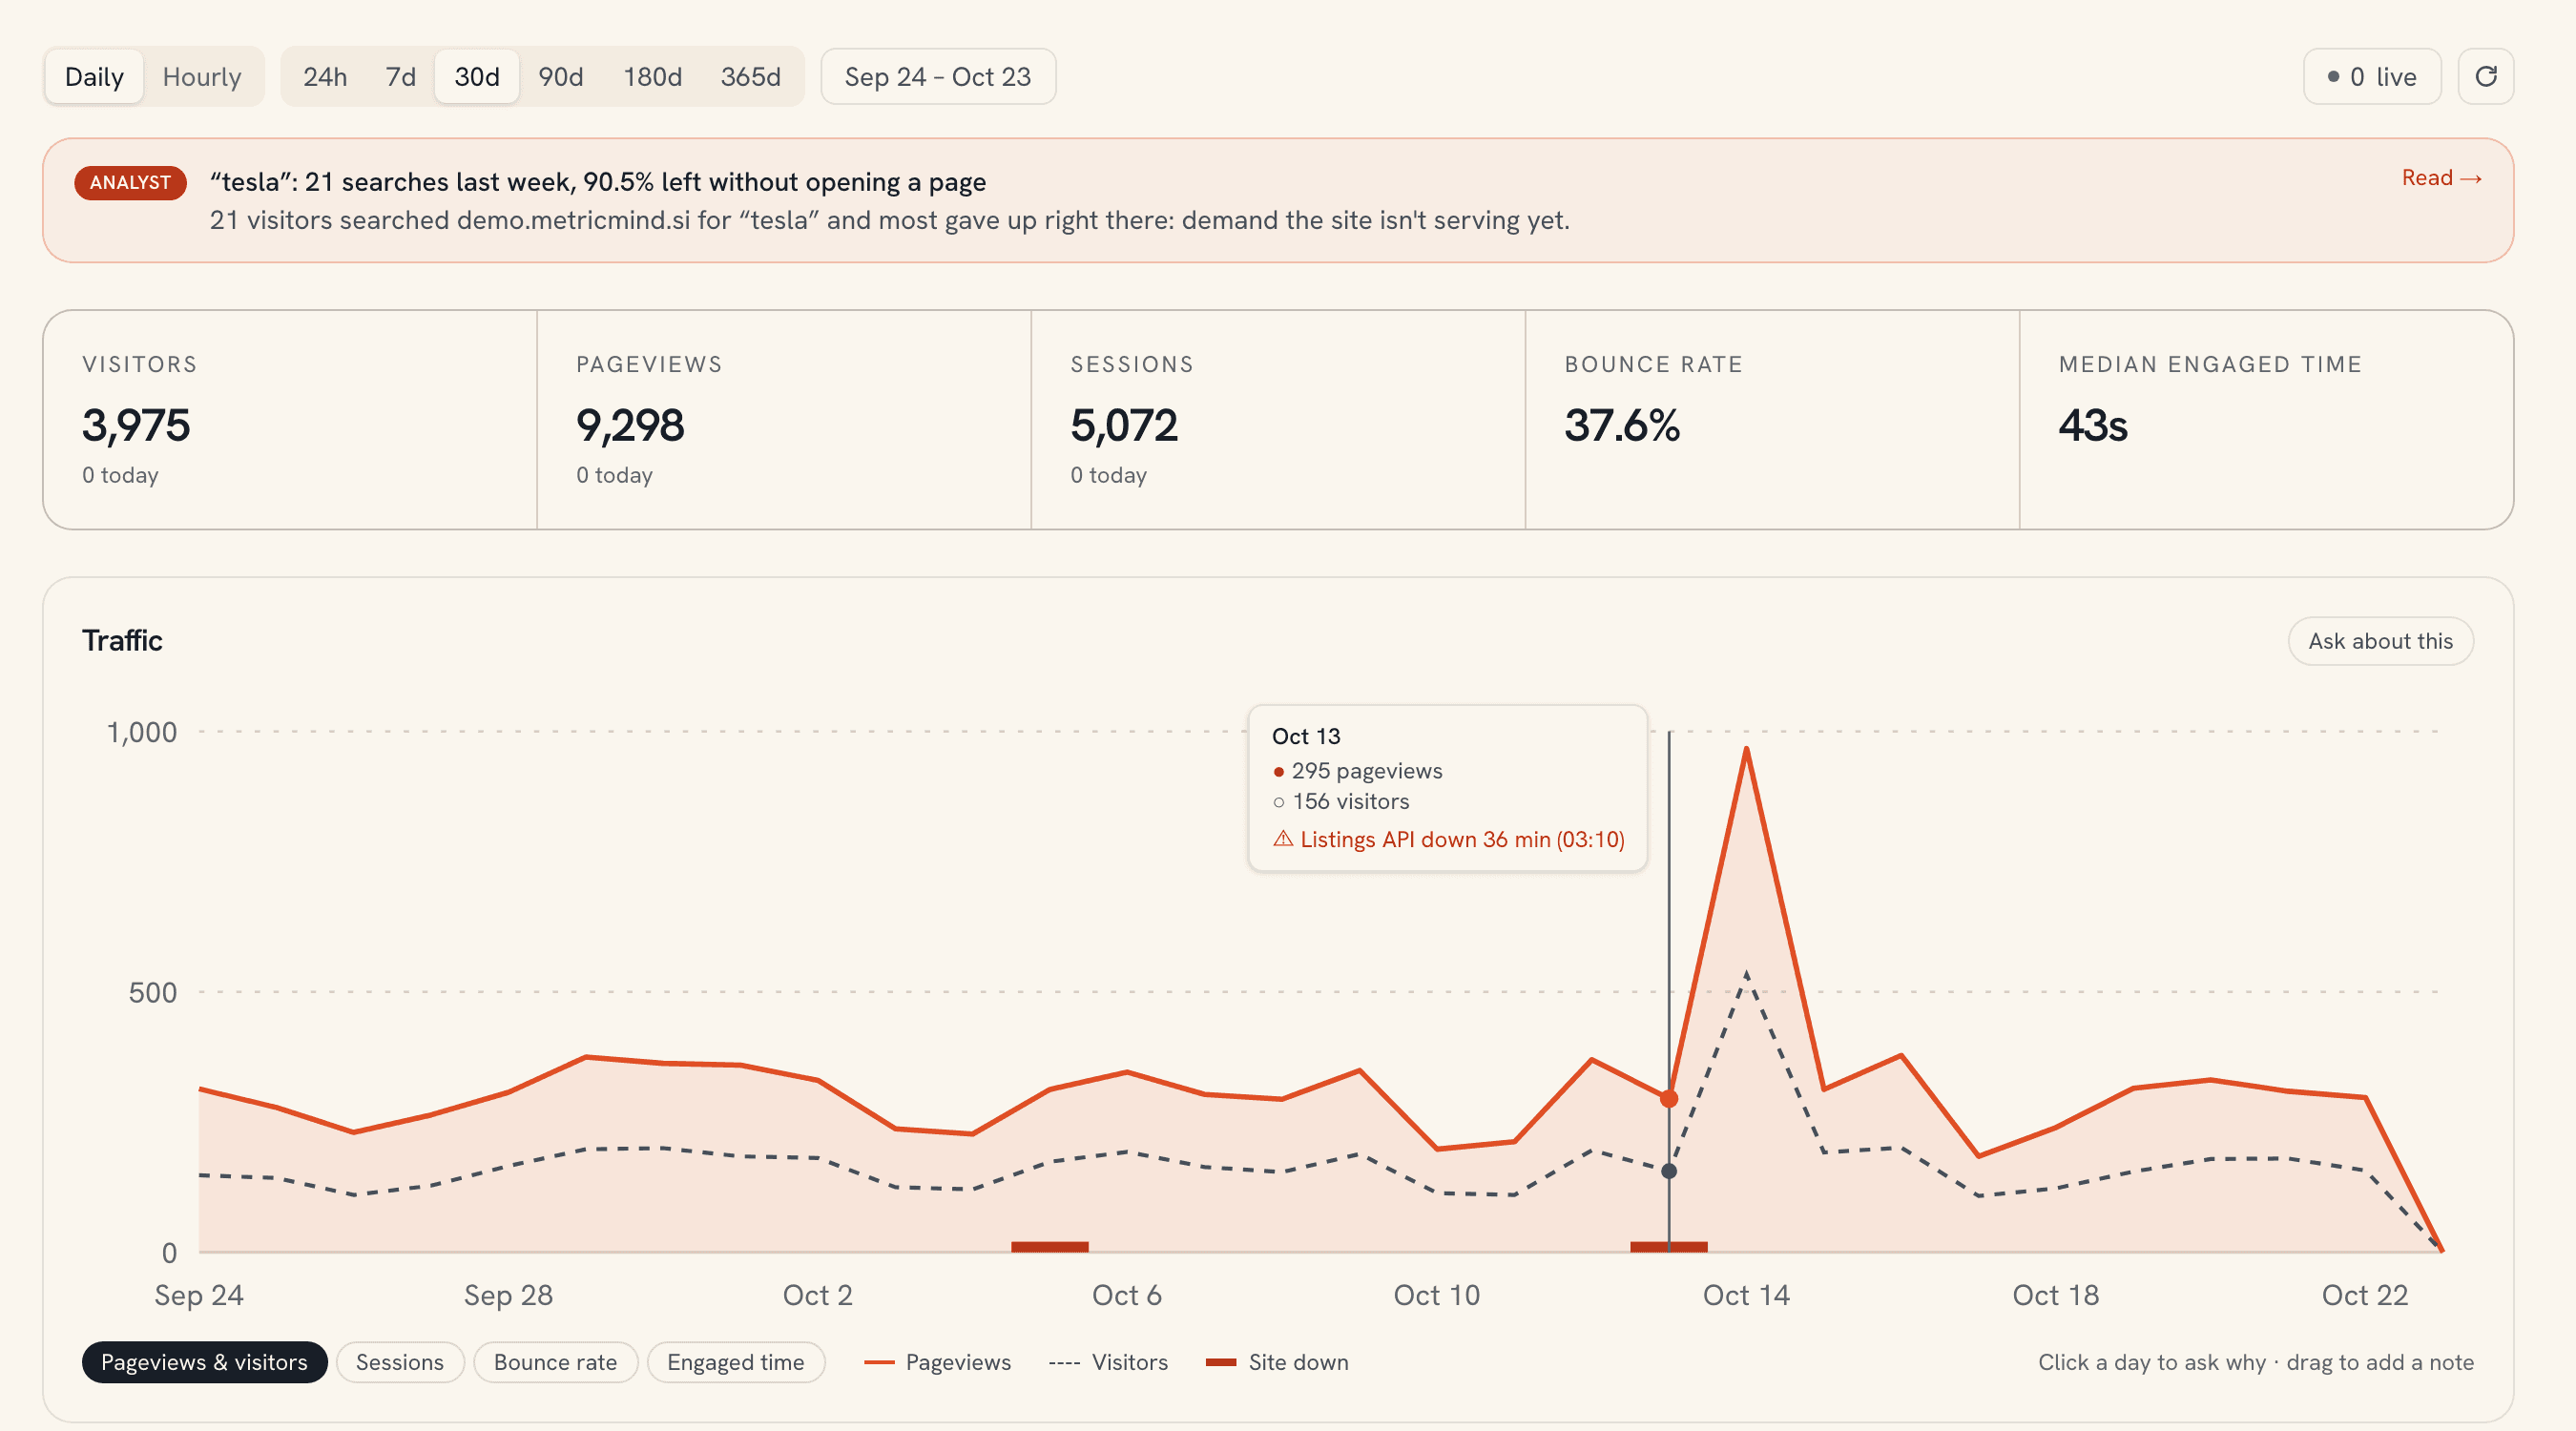
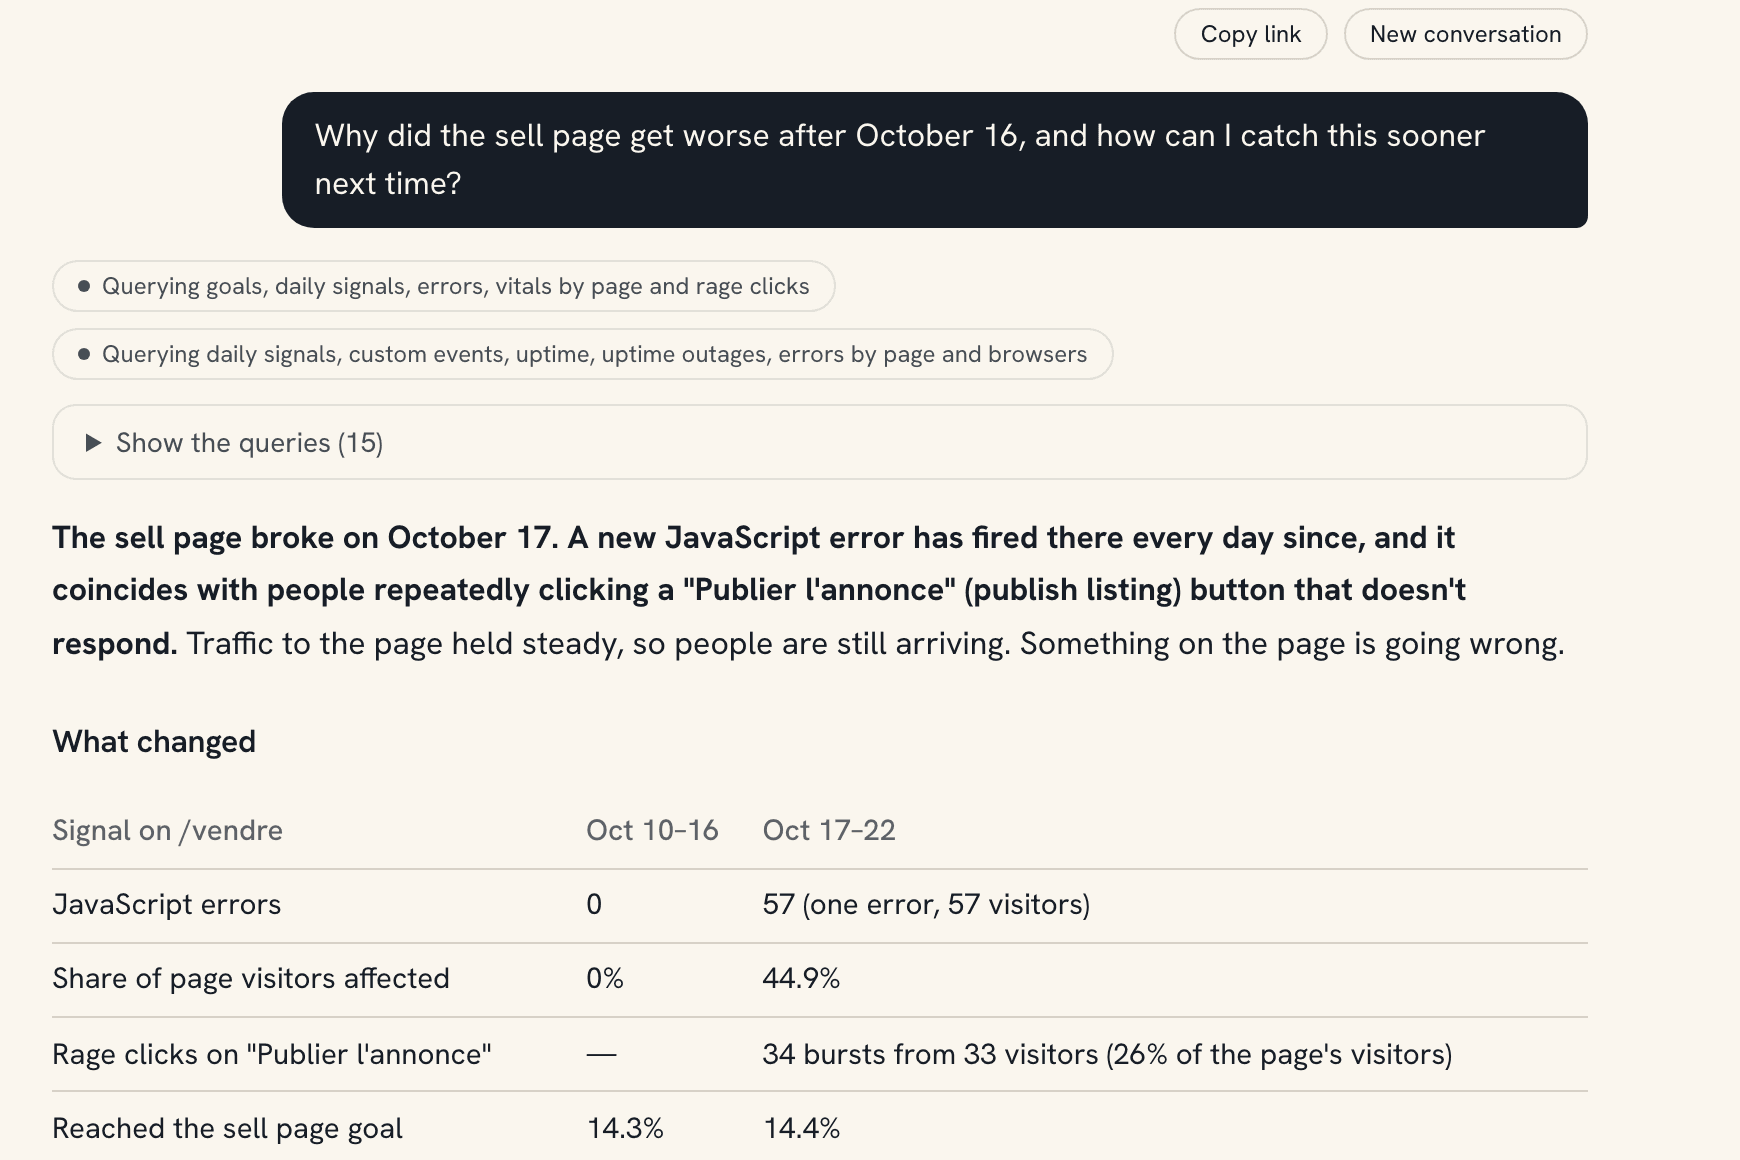
What it reads,
from one script.
Most teams stitch together an analytics tool, a performance monitor and an error tracker. MetricMind collects all of it from the same visit, so the analyst can connect the dots.
- ChatGPTAI46%
- Google22%
- Direct18%
- Instagram9%
- PerplexityAI5%
Traffic and sources
Pages, referrers, UTM campaigns, countries and devices, counted per visit. Visits from ChatGPT, Claude and Perplexity are recognised even when they send no referrer.
- 1.8 sLCPgood240 msINPneeds work0.02CLSgood
Web Vitals
LCP, INP, CLS, FCP and TTFB from real visitors, by page and device, judged against Google’s thresholds.
- Contact clicks below 2 per day1 yesterday · your alert09:00
- New error on /checkout41 visitors in its first hour14:12
- Traffic spike: 3× a typical hourmostly from chatgpt.com18:40
Alerts in plain words
New errors hitting real visitors, an app release that crashes more than the last one, tracking that stops after a deploy, traffic spikes, and your own rules, like “contact clicks below 2 a day”. By email and Slack, within minutes.
- 15.4%Control23.6%One-page form
Contact rate · p < 0.001 · roll it out
Experiments and feature flags
Roll out to a share of anonymous visitors or run an A/B test. The analyst reads the result on your goals and won’t call a winner too early.
- Show the number
Rage click · 3 visitors on /listing, 14% of the page
Errors and rage clicks
Exceptions grouped by message and page, explained in plain words, plus the buttons people click again and again because nothing happens.
- 100% see the top
- 62% reach the photos
- 31% reach the seller
Scroll depth
How far down each page visitors get, and how long they stay, so you know whether anyone sees what’s below the fold.
- velo electrique
Demand gap
21 searches last week · 90% left without opening a page
Site search
What visitors type into your search box, and which searches end the visit: demand you could be serving. Emails and phone numbers are never recorded.
- WhatsApp41
- Contact button27
- Phone12
- +212 6•• ••• ••• · numbers are never stored
Contacts without code
Clicks on phone, WhatsApp and email links, and on buttons like “Contact the seller”, count as contacts automatically. The numbers themselves are never stored.
- Home100%
- Search64%
- Listing41%
- Contact12%
Goals and funnels
Track sign-ups with one call or a data-track attribute. Build funnels yourself, or accept the ones the analyst proposes.
99.96% · 30 daysdown 11 min, Oct 12
Uptime and status pages
Checks every minute, down after two failures in a row, outages marked on your traffic chart, and an optional public status page.
› which pages got slower this week?
metricmind · get_data(vitals_by_page, 7d)
/listing LCP 2.1 s → 3.4 s since Tue
For your coding agent
Claude, Cursor and other MCP clients get read access to the same metrics, with the query behind every number. Ask from your editor which page got slower.
Set up before your coffee cools.
- 1
Add one tag
Drop the script in your <head>. It loads deferred, configures itself from data attributes, and never blocks rendering.
<script src="https://cdn.metricmind.si/mm.js" data-site="YOUR_SITE_ID" defer></script> - 2
Data flows in quietly
Pageviews, vitals and errors are batched into small requests, with no cookies and no personal profiles. Even the last pageview leaves with sendBeacon when the tab closes.
mm.track("signup", { plan: "pro" }) - 3
Read the briefing
Your analyst starts learning your normal from day one. Ask it anything, or wait for the first morning briefing.
“What changed since Monday?”
“We count visits. We don’t collect people.”
What arrives
What we keep
IP 196.74.••.••
Country: Morocco
Mozilla/5.0 (iPhone; CPU iPhone OS 18_1…
Mobile Safari · iOS
/listing/peugeot-207?ref=wa&phone=06…
/listing/peugeot-207
Cookie: none needed
nothing
Typed in search: jean@mail.com
nothing
- No cookies. Visits are measured with first-party storage you can clear at any time.
- No fingerprinting and no cross-site tracking, ever.
- The AI analyst never sees identities: emails and other traits you send with identify() stay out of its reach.
- IP addresses are never stored.
- Data hosted in the European Union (Hetzner, Germany).
- Opting out is one call — mm.optOut() — or clear your site data. Measurement stops and the stored IDs are deleted.
Free while we’re in beta.
Join the waitlist for early access to analytics and the analyst. When paid plans arrive, you’ll pay for events, not seats, and beta users keep a generous free tier.
Questions, answered.
Will the analyst change anything on its own?
No. When the next step is to measure or test something, it proposes a goal, a funnel, a timeline note or a feature flag (created switched off), and nothing is created until you click it.
How is MetricMind different from other analytics tools?
Most analytics tools give you dashboards and leave the reading to you. MetricMind collects traffic, Web Vitals, errors and uptime from one cookieless script, and a built-in analyst explains what changed, checks the obvious causes first, and shows the query behind every number. Data is hosted in the EU, and coding agents can read the same metrics over MCP.
What data does the AI see?
Your question and the aggregated metrics needed to answer it. It never receives individual visitor records, because we don’t keep any.
Can it be wrong?
Yes, which is why every answer shows its query and every finding lists its evidence. When the data doesn’t point to a cause, the analyst says so.
Do I still need a cookie banner?
MetricMind sets no cookies and builds no profiles, which removes the most common reason for one. Your legal obligations depend on your jurisdiction and the rest of your stack, so check with your counsel.
Will it slow my site down?
The script loads with defer, batches network calls, and uses idle time for non-urgent work. Your visitors won’t feel it.
Does it work for mobile apps?
Yes, in beta. iOS, Android, React Native and Flutter SDKs measure screens, sessions, events, users, errors and crashes on the same site as your website, split by platform and app version, with crash-free sessions per release. No advertising ID, no fingerprinting and no tracking prompt; the docs list exactly what to declare to Apple and Google, and apps can wait for consent before measuring.
Does it work with single-page apps?
Yes. Client-side navigation in Next.js, React Router, Vue and others is picked up automatically.