How to run an A/B test on a small site, and when not to
By Moha Ousaid Saaid, founder · Updated · 6 min read
Before you start, work out how many visitors the test needs. At 100 visitors a day and a 5% conversion rate, detecting a 20% lift takes about 164 days, while a 50% lift takes 30. If the plan takes more than about eight weeks, don't run the test: make the change, write down the date and compare before and after. If it fits, split traffic once, leave it alone until the planned sample and at least a full week, then read the result.
How many visitors does an A/B test need?
More than most small sites expect. The number depends on your current conversion rate and the smallest lift worth detecting. This table uses the standard formula for comparing two rates, two-sided at 95% confidence with 80% power. It's the same calculation our product runs.
| Current rate | Detect +10% | Detect +20% | Detect +30% | Detect +50% | Detect +100% |
|---|---|---|---|---|---|
| 1% | 163,095 | 42,693 | 19,827 | 7,750 | 2,319 |
| 2.4% | 66,946 | 17,511 | 8,126 | 3,172 | 945 |
| 5% | 31,234 | 8,158 | 3,780 | 1,471 | 435 |
| 10% | 14,751 | 3,841 | 1,774 | 686 | 199 |
| 20.7% | 6,231 | 1,610 | 738 | 280 | 78 |
"+20%" here means relative: a 5% rate rising to 6%. To turn it into days, double the number for two variants, then divide by your daily visitors who actually see the page being tested. They are not your whole site's visitors.
| Visitors a day on the tested page | To detect +20% | To detect +50% |
|---|---|---|
| 30 | 544 days | 99 days |
| 100 | 164 days | 30 days |
| 300 | 55 days | 10 days |
| 1,000 | 17 days | 7 days, at the one-week minimum |
Here's how to read that. A 100-visitor-a-day page can catch a change that lifts conversion by half, in a month. It can't catch small tweaks in any useful time. A new button colour isn't a test you can run; a shorter form or a clearer offer might be.
Why can't you just stop when it looks like it's winning?
Because a test watched daily finds winners that don't exist. A p-value assumes you fixed the sample in advance, as Evan Miller explained back in 2010.
We wanted a number you could picture, so we simulated it. We ran 20,000 tests where both variants were identical: a 5% conversion rate, 50 visitors per variant per day, for 28 days. Each day, a normal two-proportion test looked for a significant result at 95%.
| When you read the result | Tests that showed a "winner" |
|---|---|
| Once, at the end of 28 days | 4.9% |
| Every day, stopping at the first significant result | 26.5% |
That's about one test in four declaring a winner when there's nothing to find, more than five times the rate you thought you'd signed up for. It's nearly the same at other traffic and conversion levels we tried, at 26.7% with 200 visitors a day and 27.2% at a 2.4% rate. Running 56 days of daily checks raised it to 32.9%, so patience alone doesn't help if you keep peeking.
Some tools handle this differently. PostHog's best practices describe a sequential mode built to allow checking as you go. That's a sound approach as well. A plain fixed-sample test is simpler to explain, and it's what we use.
How do you run a test properly? Step by step
- Write one sentence first. "A shorter form gets more people to send it, because the current one asks for things sellers don't have to hand." If you can't say why, you're guessing.
- Pick one deciding metric, before you start. A contact or a sent form is better than a click. Picking the best of ten after the fact is how you fool yourself.
- Calculate the plan from your actual rate and traffic, using the table or any sample-size calculator.
- Assign each visitor once. They should keep seeing the same variant when they return.
- Run at least one full week, so weekdays and weekends both count. People behave differently on each.
- Check the split, not the winner. If you set 50/50 and got 60/40, stop and find out why. Don't read the result.
- Read it once, when the plan is met. Then make the call.
When shouldn't you run an A/B test?
Our rule, in order:
- The plan takes over about eight weeks. Seasons, campaigns and other changes pile up, and you'd likely stop early anyway. The eight weeks is our judgement, and no law sets it.
- You'll have under 5 conversions on a variant. Our product won't call a result then, since the test behind it isn't reliable with so few.
- Something is obviously broken. Fix a JavaScript error. Don't test it.
- The change is required or clearly better. A legal fix, or a page your customers have complained about.
- You can't act on either result. If you'd ship it whatever the data said, the test only spends time.
What do you do instead on a small site?
- Make bigger changes. A rewritten offer or a shorter form can move a number by enough to see. See the +50% column above.
- Test high up the path. A step with a 20% rate needs far fewer visitors than one at 2%, so a page view or form start can be readable where a sale isn't. It's only a stand-in, so say so.
- Compare before and after. Write down the date. Compare the same number of full weeks before and after, on the same weekdays. It isn't proof, since a holiday or a campaign can move it too, but it beats memory.
- Watch five people use it. This finds big problems with no traffic at all. Our post on visitors who don't become customers explains how.
- Check it isn't noise. Before you credit your change, see whether the number moved beyond normal weekly swings. Why your numbers differ helps too, if two tools disagree.
How MetricMind shortens this
Experiments run on feature flags, which are in alpha, and come with every plan. They're built to make the mistakes above hard to make. Here's a plan from our demo site: the goal Listing contacted, converting at 15.4%, at 157 visitors a day reading the flag. Detecting a 20% change needs 2,321 visitors per variant, or about 30 days.
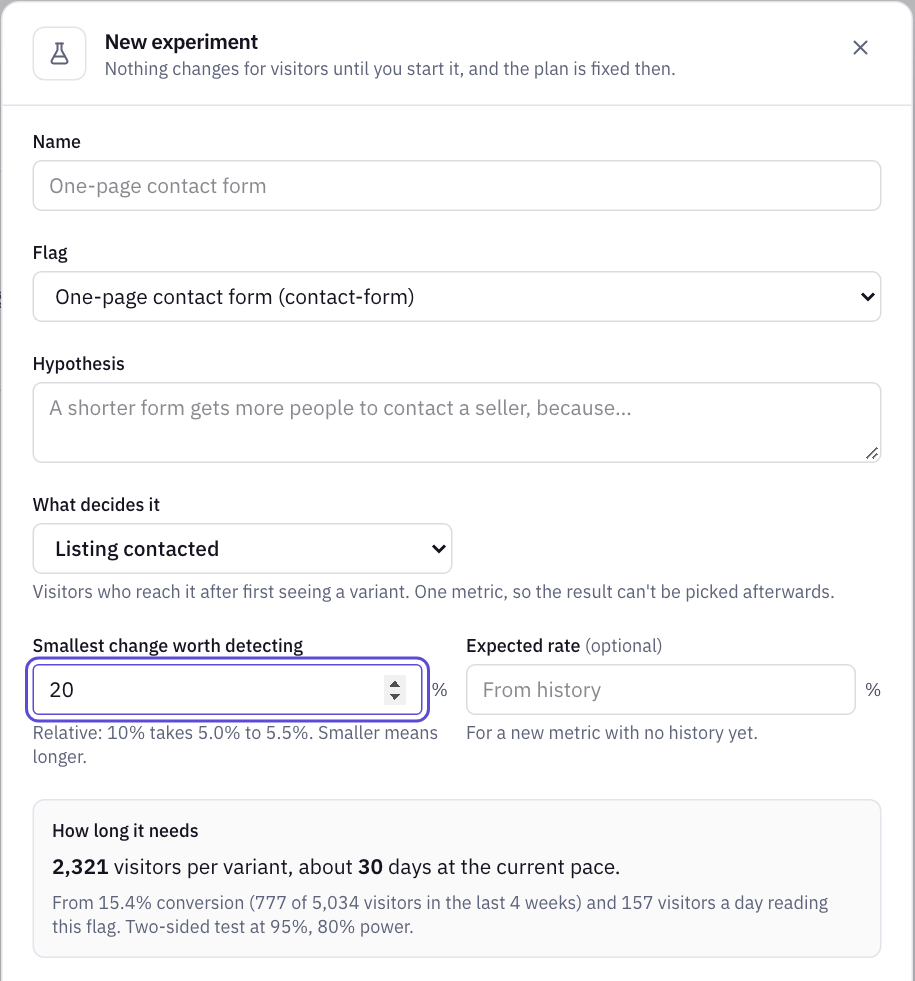
- The plan is fixed when you start, with one deciding metric, so the result can't be picked afterwards.
- Nothing is called before the plan is met. Until then it says "too early to call", however good the p-value looks that day. Once the sample's there, it still waits for seven days.
- It warns about a bad split. If shares are off beyond chance (a sample ratio test at p under 0.001, from 100 visitors), it says not to trust the numbers.
- More variants raise the bar. The significance level is divided between comparisons, so testing four things needs a larger sample.
- A variant that doesn't win gets a plain answer. It says no clear difference, and that running longer until it looks better would only produce a false win.
Your code has to read the flag, with a small call in the tracker or an SDK. See feature flags in the docs. And it won't save you from the table above. If your plan says 164 days, it'll say so, and you should do something else.
Your next step
See the plan before you start
The live demo has a flag and goals to try it with: pick what decides the test, and the form tells you how long it needs. No sign-up.