My traffic dropped: how to find out why in 15 minutes
By The MetricMind team · Updated · 5 min read
In 15 minutes you can find out whether a traffic drop is real, which source or page lost the visitors, and the day it began. Check the measuring first, because a broken tag looks just like a lost audience. Then split the drop until one slice holds most of it, and look for what changed on that day. The fix may take longer. Knowing where to look shouldn't.
You need your analytics tool and, if you get traffic from Google, Search Console. Keep a note open. Everything below works with any analytics tool.
Minutes 0 to 3: is the drop real?
Rule out the false alarms before you read anything into the chart.
- Are you comparing like with like? Today so far against a whole day always looks bad. So does a Sunday against a Tuesday. Compare a finished day with the same weekday last week.
- Is the site up? Open it on your phone, on mobile data, and go through to a product or contact page.
- Is the tag still there? Open your page's source and search for your analytics script. Then look at your browser's Network tab and check that the request succeeds. A theme update, a new consent banner or a stricter security policy can each stop it.
- Do other numbers agree? Orders, enquiries, Search Console clicks and ad platform clicks are counted elsewhere. If orders held steady while analytics fell by half, suspect the measuring.
Minutes 3 to 5: read the shape
Look at daily numbers across the last eight weeks, on a chart with nothing else on it. The shape narrows things down quickly.
| What you see | Look first at |
|---|---|
| A cliff, in every source at once | An outage, a release, a missing tag, or a noindex or robots.txt mistake |
| A cliff in one source | That source: a campaign that ended, a lost ranking, a removed link |
| A slope over weeks | Season, falling demand, or rankings slipping page by page |
| A fall right after a spike | Probably nothing. The spike was the odd one, and this is your normal level |
| One bad day inside the usual range | Nothing yet. Look again tomorrow |
That last row matters more on small sites. If the day sits within what the same weekday has done over the past eight weeks, you have a swing and no drop. Stop here and get on with your day.
Minutes 5 to 10: split it until one slice holds most of it
Compare the bad period with the one before, and split it one way at a time. For each row, work out the change in visitors, not the percentage. Percentages flatter small rows: a referrer going from 4 visitors to 1 is a 75% fall that explains nothing.
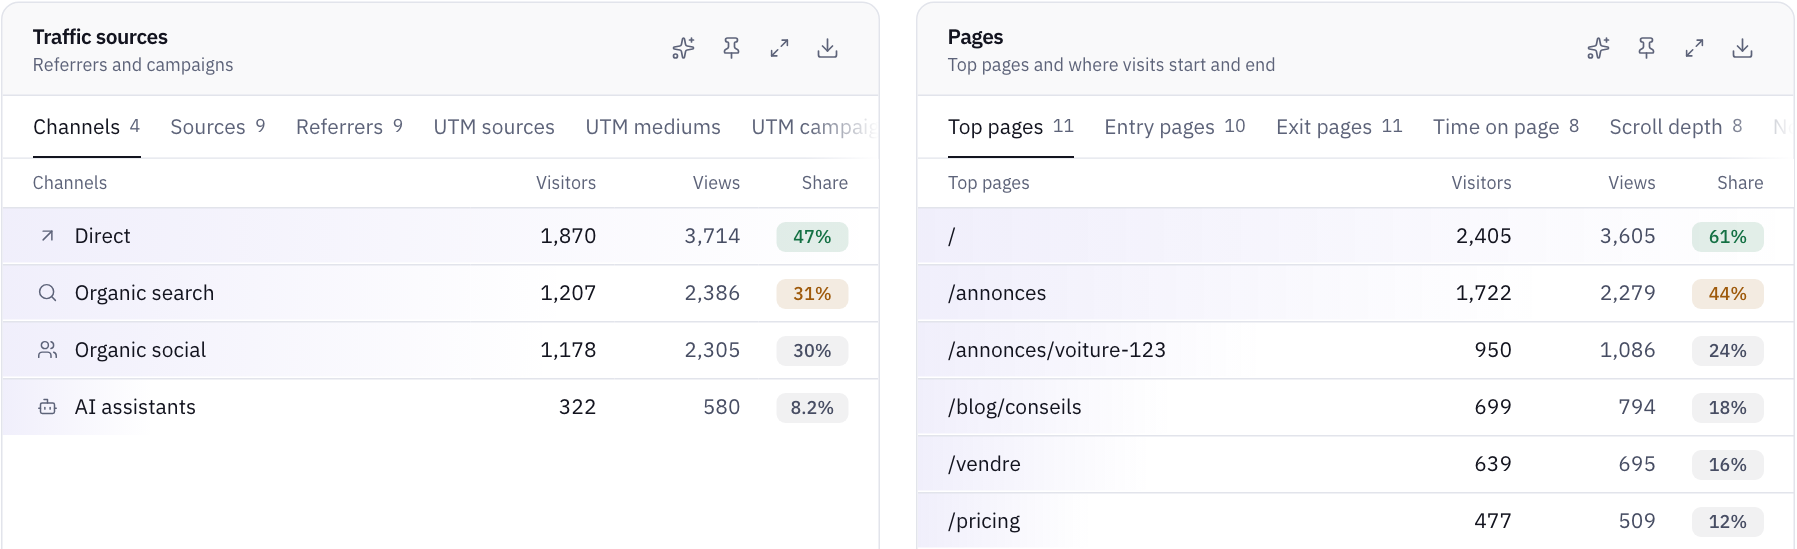
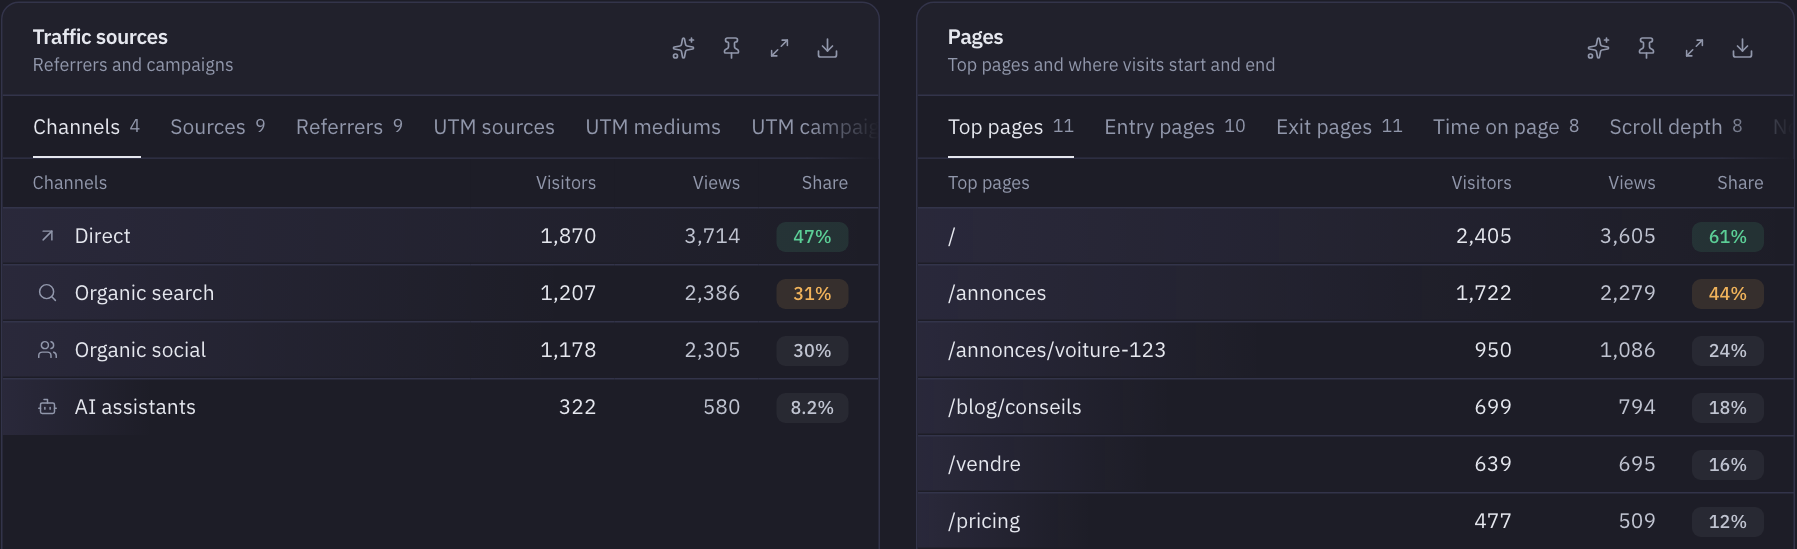
- By source or channel. Search, paid, social, email, referral, direct. For example, if the total fell by 500 and search fell by 450, you've found your slice.
- By landing page. Inside that source, did every page fall, or a few? One section falling points at that section. Every page falling points at the whole site.
- By device and browser. A fall on one browser or only on phones suggests something broke there, which is good news: it's usually fixable today.
- By country. One country falling can mean ad targeting, a local holiday, or a problem with a local network or payment method.
Stop as soon as one slice explains most of the change. You don't need all four.
Minutes 10 to 14: find what changed that day
Now you know where and when. Pick the row that fits.
| What fell | What to check |
|---|---|
| Google search | Search Console's Performance report: which queries and pages lost clicks, and whether impressions fell too |
| Paid | Budget, billing, ended campaigns, disapproved ads, and whether a new link dropped its UTM tags |
| Social or referral | Whether last month's number came from one post or link that has simply run its course |
| Whether you sent the usual newsletter, and whether its links still carry tags | |
| Direct | Direct is what's left when no source is known, so a change in tagging can move visitors in or out of it |
| Everything | Your releases, plugin updates, DNS and certificate changes, and your host's status page on that day |
If it's Google, use its own checklist. Google's guide to Search traffic drops names six kinds of cause: algorithmic updates, technical issues, security issues, spam issues, seasonality or changing interest, and site moves. It points to these reports:
- Page indexing and Crawl stats, for technical problems.
- Manual Actions and Security Issues, for a penalty or a hacked site. Check both, because each takes seconds.
- Google Trends, to see whether people stopped searching for this altogether. If demand fell everywhere, it wasn't you.
- Search Console's Data Anomalies page, in case the numbers themselves had a problem.
The Google Search Status Dashboard also lists incidents in crawling, indexing, ranking and serving, with dates you can hold against your own.
Minute 15: write it down
One line is enough: what fell, by how many, since when, the likely cause, and what you'll check next. For example: "Google clicks to /shoes down since the 14th, impressions too, no technical errors. Check again on the 21st."
Then choose one: fix it, wait, or watch it. Avoid changing five things at once in a panic, since you won't be able to tell afterwards which of them helped. Google also notes that small shifts in position may need no action at all.
How MetricMind shortens this
Everything above works with free tools. MetricMind does the arithmetic for you and keeps the evidence on one page.
- The comparison is built in. Press X on the dashboard to see the previous period. A period still running is compared up to the same clock time, so today's morning isn't judged against yesterday's whole day.
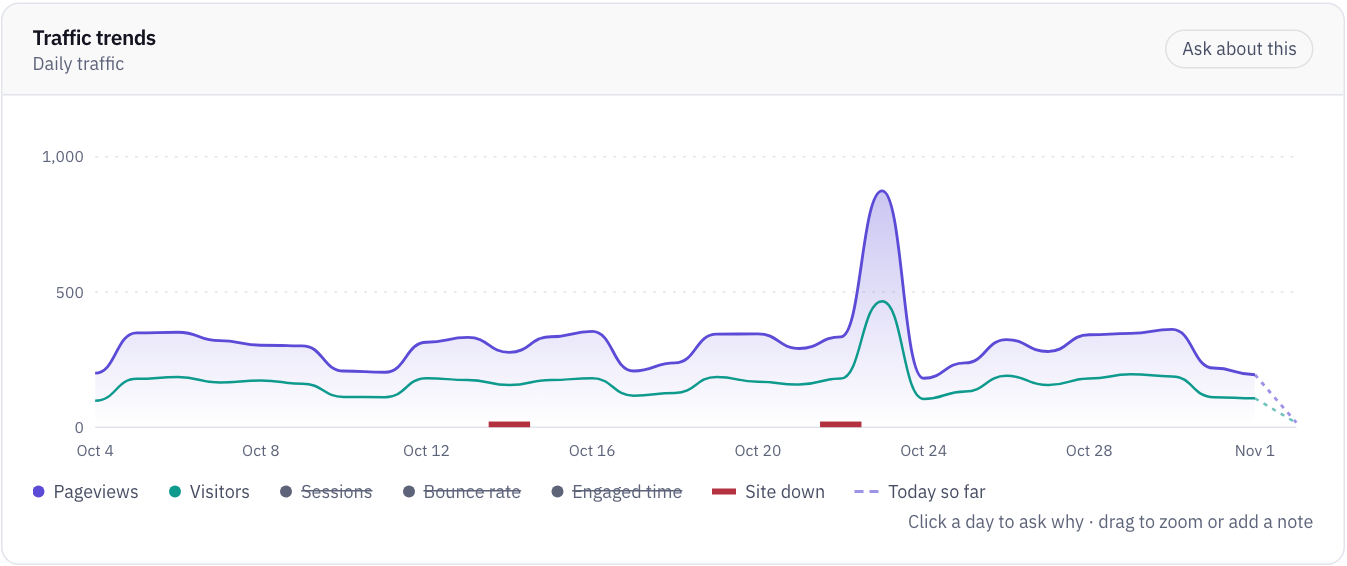
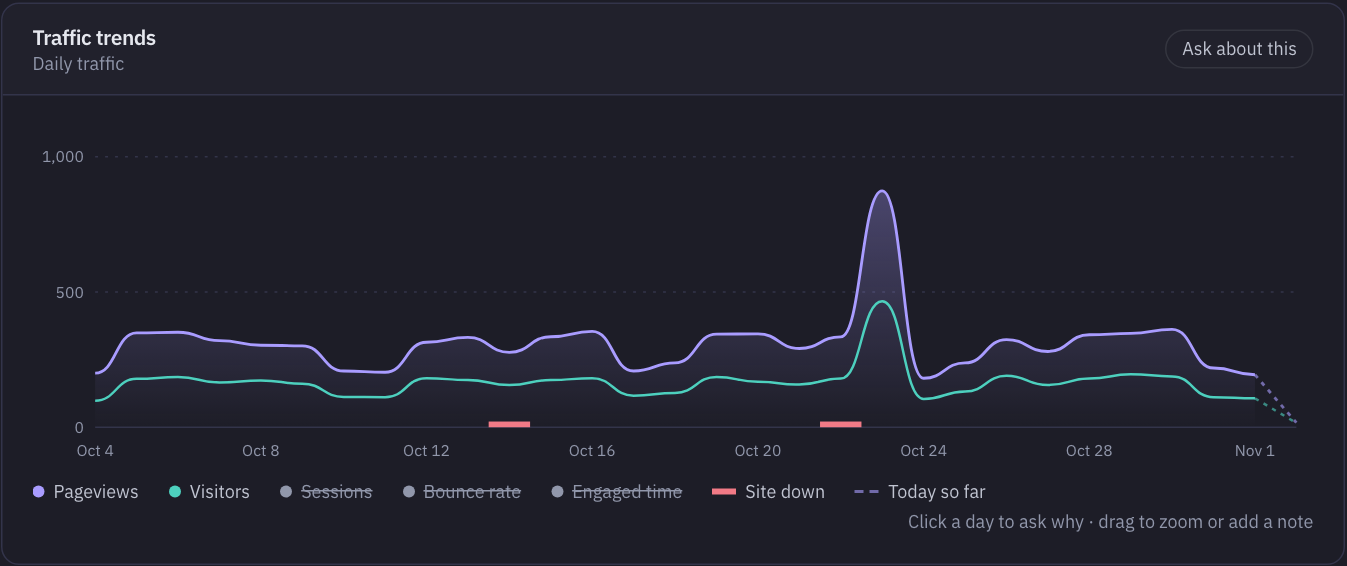
- Click a bad day on the chart and ask why. The analyst splits the change across source, page, country, device, browser and platform, ranks each by its share, and shows the query behind its answer. Every plan can ask, with a monthly allowance; the free plan has a few questions.
- Outages, errors and notes sit with the traffic. Uptime failures mark the chart, JavaScript errors have their own page, and you can add notes to the timeline or connect GitHub so releases appear by themselves.
- Changes are detected every morning. Each day is compared with the same kind of day, and normal swings stay quiet. Detected changes are listed on every plan. Written investigations like the one below come with Business and Scale.
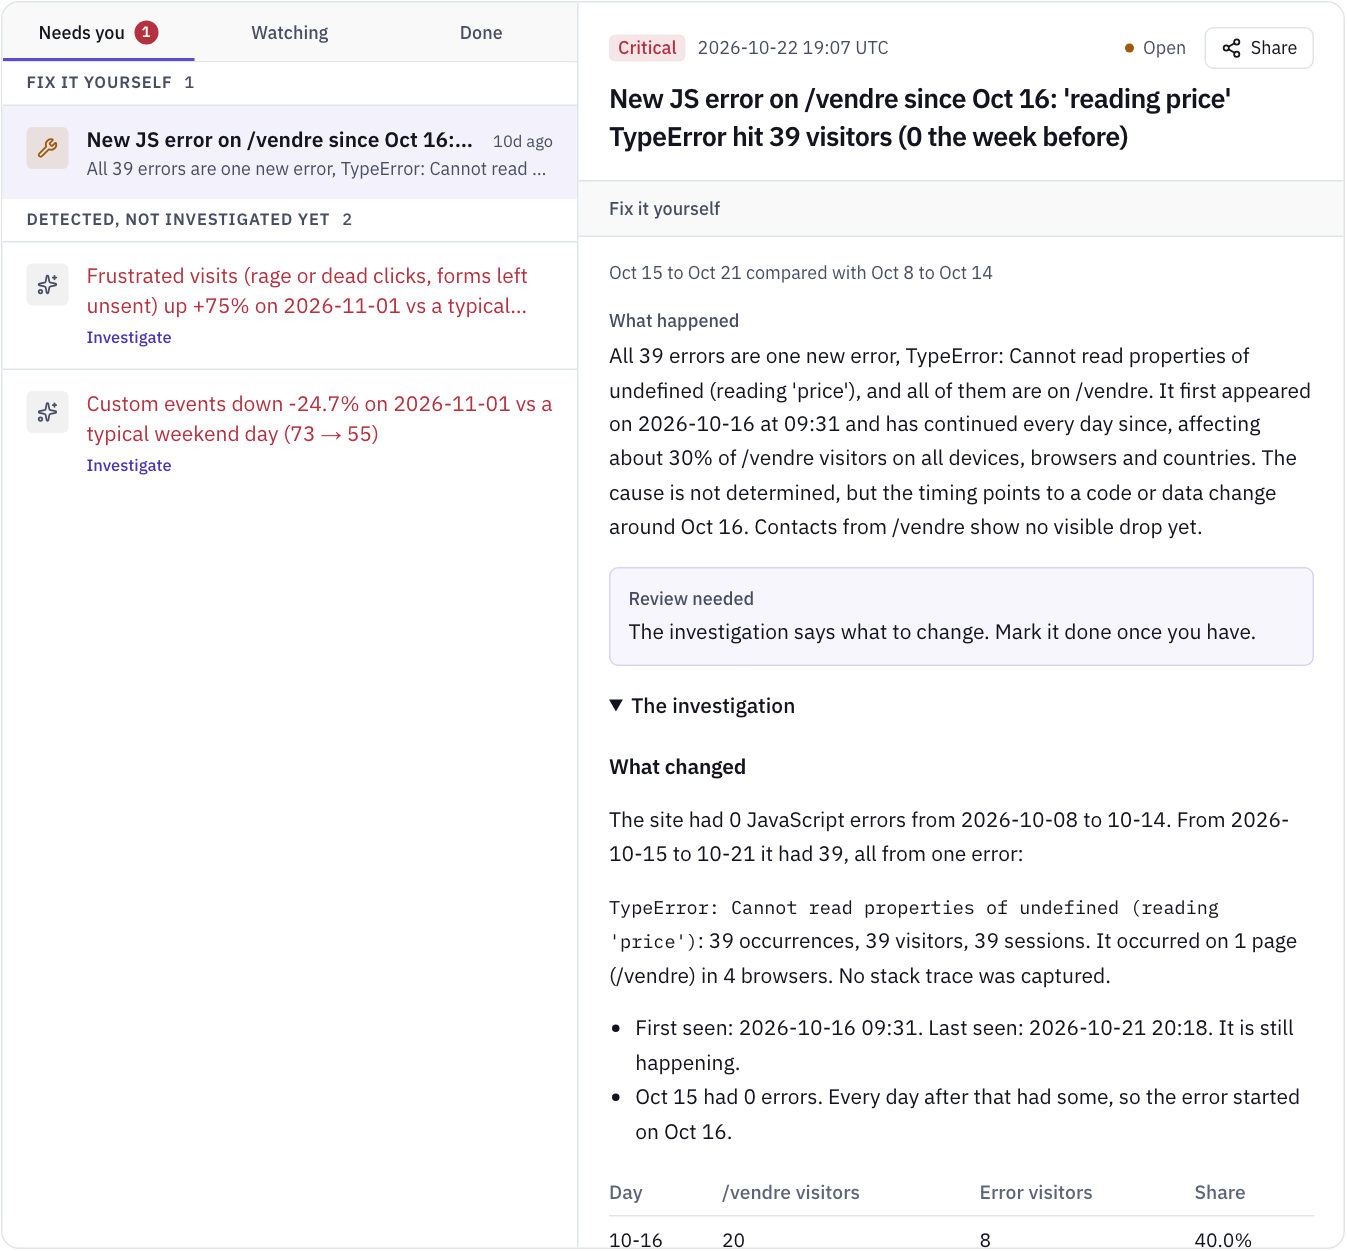
Two limits. MetricMind doesn't have Search Console data yet, so for a Google drop you still open Search Console. And no tool can report what it never received: if your tag is gone, the chart just falls. That's why minute 0 asks you to check it, and why an uptime monitor is worth having.
Your next step
Try this routine on a sample site
The live demo is a sample marketplace with real dashboards and analyst answers. No sign-up.