Real change or normal swing? How to tell without statistics training
By Moha Ousaid Saaid, founder · Updated · 5 min read
Compare the day with the last eight days of the same kind, weekdays with weekdays and weekends with weekends. Take their median, work out how far they typically sit from it, and count how many of those typical gaps your day is away. Three or more means it's unusual and worth a look. Under three means it's probably a normal swing, even if the percentage looks alarming. That's the rule our software runs every morning, and it fits in a spreadsheet.
Why does comparing with yesterday mislead you?
Because yesterday is one day, and days vary. On Tuesday 27 October our demo marketplace had 156 visitors, against 190 on the Monday. That's 18% down, and it would show in red on any report the next morning. It was also nothing, as we'll see.
Averages mislead too. One big day drags an average up for weeks, and every normal day after it looks like a fall.
How do you run the test in a spreadsheet?
You need daily visitors from any tool. It works for contacts, orders or errors as well.
- Pick the day you want to judge. Leave out today, because it isn't over.
- List the eight most recent earlier days of the same kind. If the day is a weekday, take weekdays. If it's a Saturday or Sunday, take weekend days. Put them in cells B2 to B9.
- In C2, enter
=ABS(B2-MEDIAN($B$2:$B$9))and copy it down to C9. This is how far each day sits from the middle. - The typical gap is
=1.4826*MEDIAN(C2:C9). The 1.4826 makes it comparable with a standard deviation. - Your score is
=(day - MEDIAN(B2:B9)) / typical gap. - If the typical gap comes out smaller than 5% of the median, use 5% of the median, and at least 1. A very flat series would otherwise flag tiny moves.
A score of 3 or more, up or down, means unusual. That's it. The statistic is the median absolute deviation, which NIST's handbook describes as much less affected by extremes than the standard deviation. NIST's outlier page gives the same recipe as a "modified Z-score" and suggests a limit of 3.5 for one-off data checks. We use 3, a little more eager to flag: a small business can ignore one extra flag, and can't get back a fall it missed.
Does it work on real numbers?
Here's the demo site's daily visitors, for the last eight weekdays before Tuesday 27 October: 175, 181, 186, 168, 158, 180, 466, 190. The 466 is a launch day. The median is 180.5, and the typical gap is 11.1.
| Day | Visitors | Against the day before | Median of same-kind days | Score | Verdict |
|---|---|---|---|---|---|
| Tue 27 Oct | 156 | -18% | 180.5 | -2.2 | Normal swing |
| Fri 23 Oct | 466 | +159% | 175 | +30 | Real, a launch |
| Sun 1 Nov | 107 | -4% | 111.5 | -0.5 | Normal swing |
That 18% fall scores -2.2. No flag, nothing to do, and the Wednesday came back at 180.
Now see why we use the median. The ordinary average of those eight days is 238, with a standard deviation of 106, because of the launch day. Using those, a day of 130 visitors would score only -1.0 and pass as normal. Using the median, 130 scores -4.5, and it gets flagged. One spike doesn't blind the rule.
What about a whole week?
A single bad day can pass. A slow slide doesn't show up as an unusual day at all, so compare the last 7 complete days with the 7 before. Here are the limits we use, and small sites can copy them. A change must clear both the percentage and the count.
| What you're watching | Change of at least | And by at least | Only if the week reached |
|---|---|---|---|
| Visitors | 30% | 50 | 100 |
| Pageviews | 30% | 100 | 200 |
| JavaScript errors | 50% | 10 | 10 |
| Page load time (LCP, 75th percentile) | 20% | 300 ms | 50 samples each week |
| Your own events | 40% | 10 | 20 |
| A goal's conversions | 40% | 5 | 15 |
| Frustrated visits | 50% | 8 | 10 |
These come from what we've chosen to alert on, not from a study. The floors exist because percentages lie at small sizes: 5 errors becoming 10 is a doubling, and it may be one person reloading a page.
On the demo site, the launch week of 19 to 25 October had 1,395 visitors against 1,112 before it. That's +25%, below 30%, so the weekly test stays quiet even with a launch inside it. The day test caught the launch. The week after fell 19%, also under the line. You need both tests, and they don't always agree.
What does a flag mean, and what doesn't it mean?
A flag says this day isn't like the others. It doesn't say why, or that it matters. Three things to do next:
- Check for a calendar reason. The rule only knows weekdays from weekends. A public holiday, a sale or a newsletter will trip it, and it should.
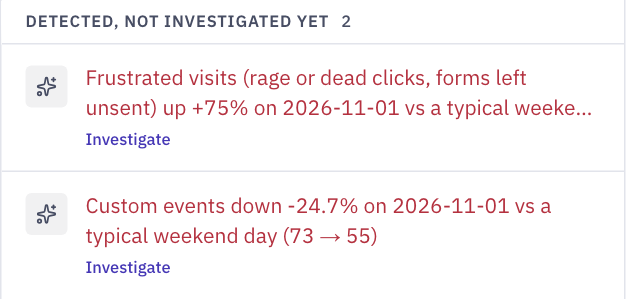
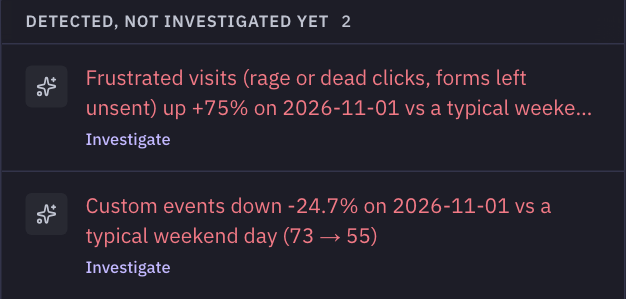
- Ask whether the size matters. A flag can be small. On the demo site, frustrated visits on Sunday 1 November went from a usual 8 to 14: +75% and worth a glance, but only six more visits.
- Then look for the cause. Our 15-minute routine for a traffic drop is the next step when the news is bad.
A score under 3 isn't proof nothing happened, either. It means you can't tell from one day. If you changed something and want to judge it, you need more data and a different test, which how to tell if your website change helped covers.
How MetricMind shortens this
All of this runs by itself each morning, on complete days, with no model involved. So it's cheap and repeatable, and the AI can't invent a change. It covers visitors, pageviews, JavaScript errors, page load, your own events, frustrated visits and goals.
- Normal swings stay quiet, and flagged changes appear under Insights on every plan, with the numbers behind them.
- Click Investigate to send the flagged change to the analyst, with its dates filled in. It splits the change by source, page, country and device, and shows the query it ran. Questions use your plan's allowance.
- Pro, Business and Scale get written investigations of what changed, with evidence and a next step: 3 a month on Pro, 100 or more on the others. Every new site gets one free first report on any plan.
- Changes that pass close themselves as recovered once they're no longer detected.
- You can write your own rule. Alerts can fire when yesterday sits more than 3 robust deviations from the previous 28 days, and a form shows how often it would have fired in the last 30 days, before you save it.
One limit: it reads only what was tracked. If your tag breaks, traffic falls for a reason it can't explain. See the analyst for what it does with a flag.
Your next step
See detected changes on a sample site
The live demo lists what this rule flagged on a sample marketplace, and the traffic behind it. No sign-up.