Analytics for mobile apps without a heavy SDK
By Moha Ousaid Saaid, founder · Updated · 5 min read
An analytics SDK is heavy in three ways: what it adds to your download, what it pulls in as dependencies, and what you must then declare to Apple and Google. Measure the first with two builds, one with and one without it. For most small apps, four numbers are enough: users per release, crash-free users, users with an ANR, and cold start time. MetricMind's SDKs are small files with no packages of their own, and they're in beta.
What makes an analytics SDK heavy?
- Download size. Code and resources you ship to every user.
- Dependencies. Libraries it brings along, each one a future version conflict and something to update.
- Runtime work. Anything done on launch adds to your cold start. Anything done on the main thread can cost you frames.
- Paperwork. Every SDK's data collection becomes your disclosure. Apple's App Privacy Details count analytics tools as third-party partners whose collection you must declare. Google Play's Data safety rules say it's your job to check third-party libraries too.
The usual choice is Firebase's Google Analytics. Google describes it as free with unlimited reporting on up to 500 distinct events, and it links to BigQuery. If you buy Google ads or want your raw data in BigQuery, it's very hard to beat, and you should probably stop reading here.
How do you measure what an SDK adds? A test for your own build
Don't trust anyone's published figure, ours included. App size depends on your build settings and what you already ship. Measure it this way, and do it before you commit.
Android. Make a release build without the SDK, then with it. Google's APK Analyzer compares the two:
apkanalyzer -h apk compare without-sdk.apk with-sdk.apk
apkanalyzer -h apk download-size with-sdk.apk
iOS. Debug builds don't count. Apple's guide to app size says to archive the app, export it for development with app thinning set to all compatible device variants, and read App Thinning Size Report.txt. Do that twice, and compare the two.
Cold start, both platforms. Launch the release build 10 times from fully closed, with and without the SDK, on your oldest supported phone. On Android, this command prints the launch time for one run:
adb shell am start -S -W com.example.app/.MainActivityWrite down the median of each set. If the difference is within the spread of your runs, the SDK isn't your startup problem.
Which numbers should a small app track?
Skip the long dashboards. Four numbers per release cover most of what goes wrong, and Google publishes limits for two.
| Number | Why it matters | Limit to watch |
|---|---|---|
| Users per release | Tells you whether a number is worth reading yet | We wait for 30 sessions on each side before comparing |
| Crash-free users | The plainest view of whether a release hurt people | 1.09% user-perceived crash rate is Google Play's bad behaviour line |
| Users with an ANR | "App not responding" freezes that users notice | 0.47%, also from Android vitals |
| Cold start time, 75th percentile | A slow launch is the first impression | We rate 2 seconds or less as good, and 5 seconds or more as poor |
Google says those two limits can affect your app's visibility on Google Play, so don't wait until Play Console shows you the bad news. A release alert should come from your own data first.
What does a bad release look like in the numbers?
Here's the planted regression in our demo app. Read the Android rows.
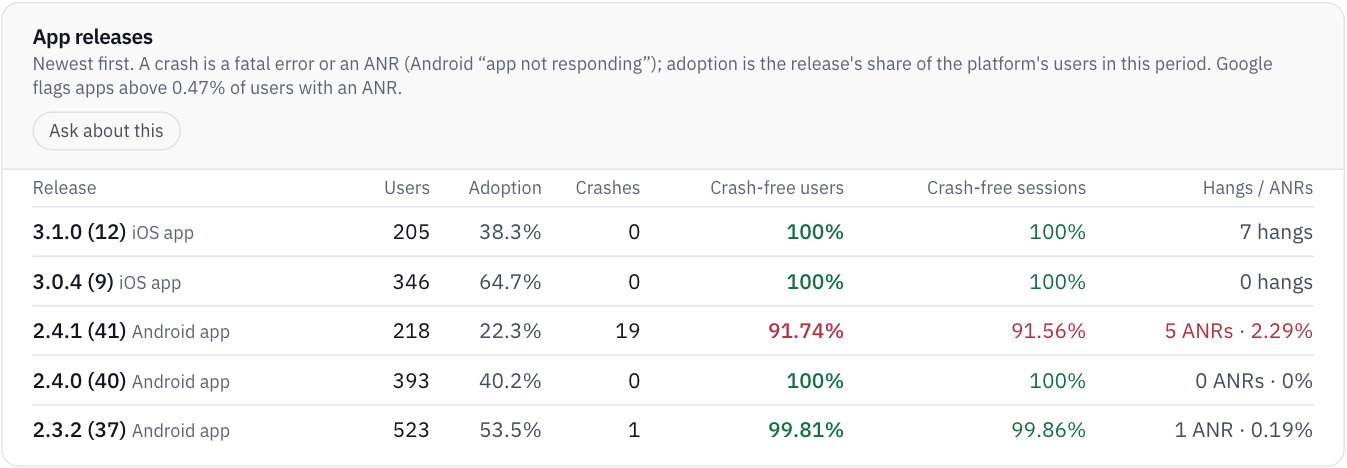
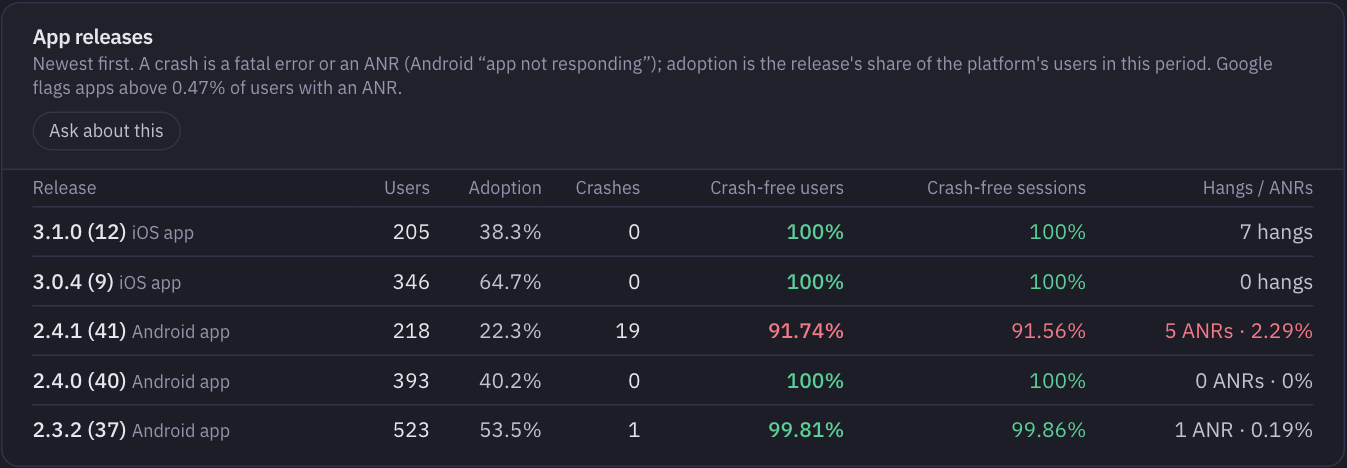
Version 2.4.1 reached 218 users, with 19 crashes and 91.74% crash-free users. Version 2.4.0 had 393 users and none. Cold start at the 75th percentile went from 2.16 seconds to 3.25 seconds. Those rows make a clear case for a hotfix, and they make it while only 22% of Android users have the update.
How the numbers are kept honest matters as much as the numbers. Events queued on the device keep the release that recorded them, so a crash sent after an update still counts against the version that crashed. Release order comes from version, then build, then first seen, so a late install of an old version isn't called newest. We alert on a release when it's at least 1 point less crash-free than the one before, with 30 sessions on each and 3 crashed sessions or more. For ANRs we wait for 50 users and 3 affected, on the share above Google's 0.47%.
Why won't app numbers match your store console?
Every tool defines an app session differently. Firebase's Analytics ends a session after 30 minutes of inactivity by default. Our SDKs end one after 30 seconds in the background, since a person who leaves an app for 10 minutes has usually finished. So expect more sessions here than in GA for the same use. Comparing two tools? Start with why analytics numbers don't match.
How do the app and the website compare?
If you run both, compare them per session, on the same actions. On the demo site, Android sessions lead to a contact 3.2 times as often as website sessions. See what a marketplace can do with that.
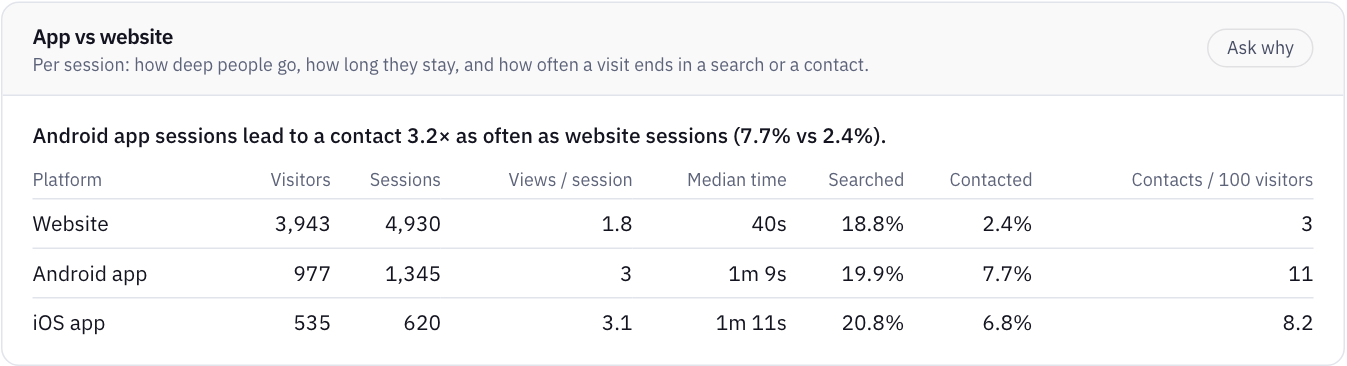
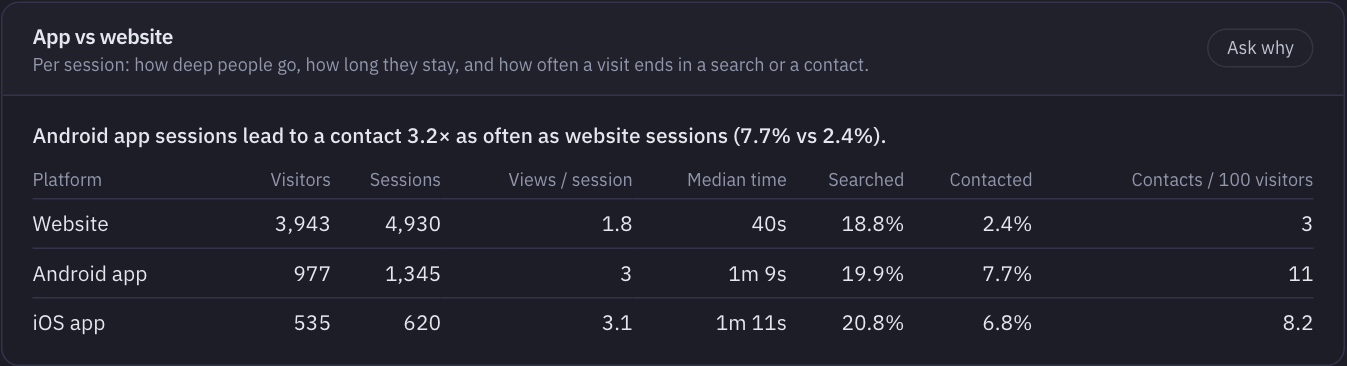
App users chose to install, so a gap isn't proof that the app is better. Treat it as a question to answer.
What does MetricMind's mobile SDK include, and what doesn't it?
| SDK | What you add | Source size | Needs |
|---|---|---|---|
| iOS (Swift package) | 2 Swift files and a privacy manifest | About 40 KB | Nothing else |
| Android (Kotlin) | 2 Kotlin files | About 42 KB | Nothing else |
| React Native | 1 TypeScript file | About 25 KB | AsyncStorage, to remember IDs |
| Flutter | 2 Dart files | About 33 KB | No plugins |
All four record screens, sessions, events, contacts, searches, errors and crashes, and send them to the same place as your website. There's no advertising ID, no fingerprinting and no App Tracking Transparency prompt. A consent mode (enabled: false) stores nothing until you opt in. Our guide to the App Store and Google Play lists what to declare.
The limits, plainly:
- They're in beta. Tested on simulators and emulators with sample apps, with less real-world use behind them than an established SDK.
- You copy files in. They aren't published on npm, CocoaPods or Maven. That keeps them small, and updating is on you.
- No session replay, push, remote config or remarketing. Feature flags are included.
- Native cold start and hangs need the native SDKs. React Native and Flutter releases show "Not measured" for those, and aren't counted as zero.
- We haven't published a measured binary figure, since it depends on your build. Run the test above.
For the details, see mobile app analytics and the mobile section of the docs. Both show the setup for each platform.
Your next step
See release health on a sample app
The live demo has an Android and an iOS app next to a website, with a planted crash regression to find. No sign-up.