Why your website is slow for real visitors, and which fix pays off first
By Moha Ousaid Saaid, founder · Updated · 5 min read
Your site is often slower for real visitors than for you because they use ordinary phones on mobile networks, and your busiest page types carry heavy images or scripts your own laptop hides. Look at speed from real visits, split by page type. Fix what's in the poor range first, on the page type most visitors reach and closest to a sale. The gap between Web Vitals tells you which fix it needs.
Why does your site feel fast to you and slow to them?
You probably test on a good computer, on office Wi-Fi, with everything already in your browser's cache. On our demo marketplace, 79% of website visitors are on phones.
That's why a lab score and real data disagree. Google's PageSpeed Insights page describes field data as capturing the real-world experience over the previous 28 days, and lab data as a controlled test useful for debugging, which may not capture real-world bottlenecks. It states that the values may differ. Use field data to decide what to fix, and lab data to work out how.
Which numbers should you look at?
Google's Web Vitals are three measures (LCP, INP and CLS), judged at the 75th percentile, which means three visits in four are at least that good. Split them between phones and computers.
| Metric | What it asks | Good | Poor |
|---|---|---|---|
| LCP, Largest Contentful Paint | How long until the main content appears? | 2.5 s or less | Over 4 s |
| INP, Interaction to Next Paint | How long until the page responds to a tap? | 200 ms or less | Over 500 ms |
| CLS, Cumulative Layout Shift | Does the page jump around while it loads? | 0.1 or less | Over 0.25 |
Two more help you find the cause. TTFB, time to first byte, is how long your server takes to start answering. FCP, first contentful paint, is when anything at all appears.
How do you find out which pages are slow?
Don't start with your home page, and don't average across the site. Split by page type: all product pages together, all listings together, the checkout. Pages built the same way are slow for the same reason, so one fix covers all of them.
To do this for free, enter your main page types in PageSpeed Insights and read the field data block if it shows one. Then open Chrome's Performance panel, which shows your own local LCP and CLS at once and INP once you interact. It has CPU and network throttling settings. Turn them on, to feel something closer to a phone.
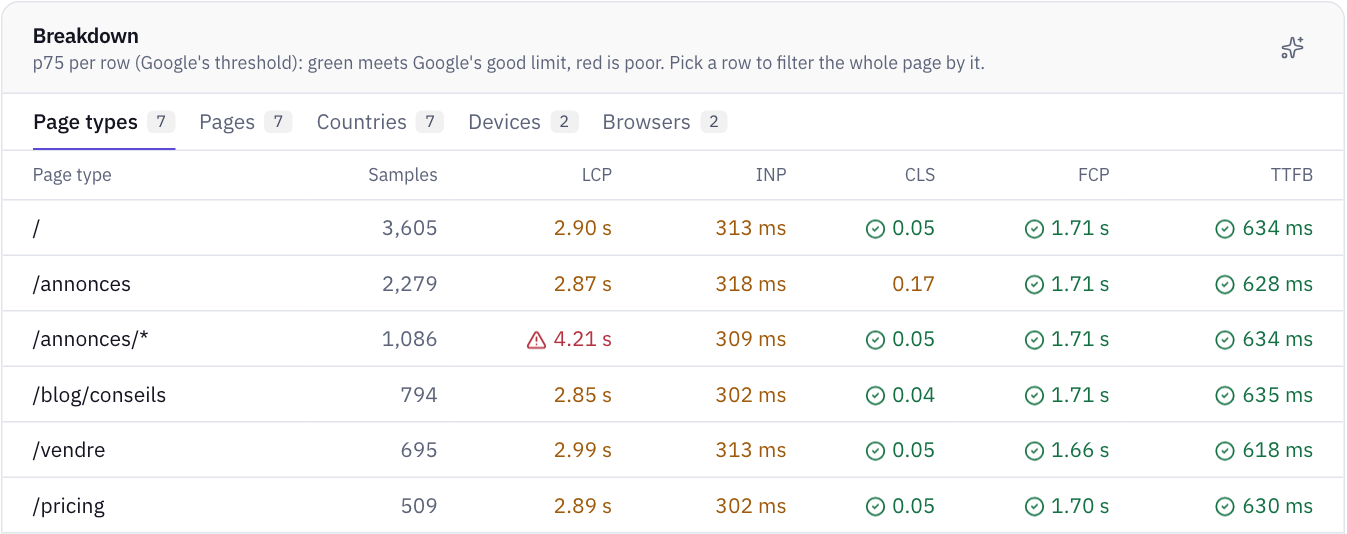
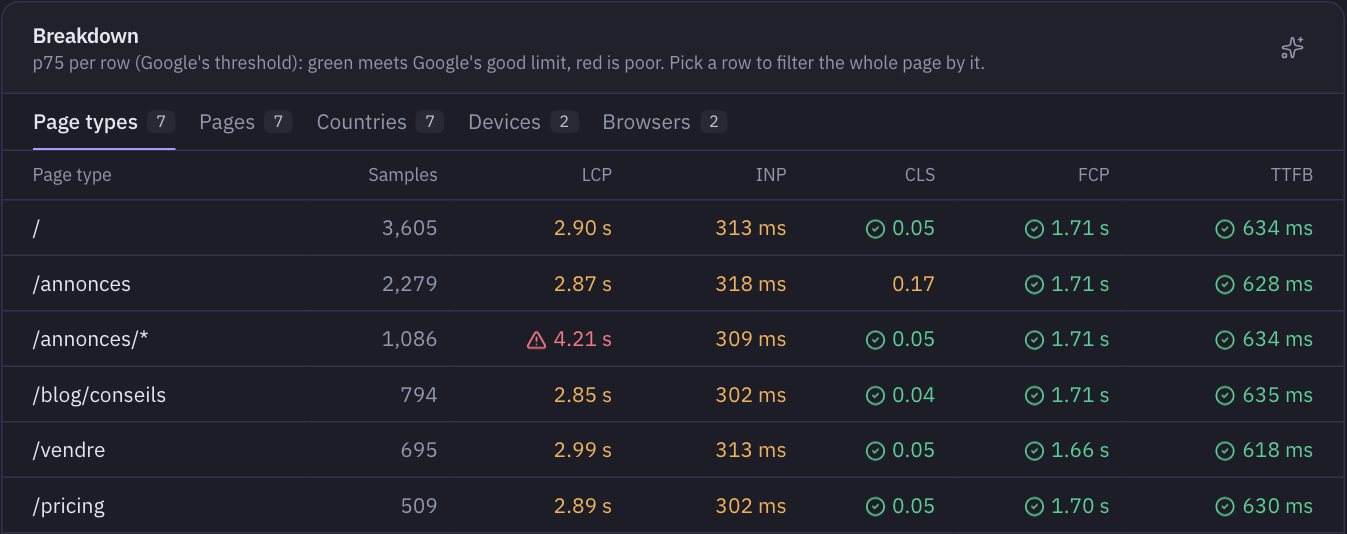
What do the patterns tell you?
Read across a table like this and you can usually tell what kind of fix you need before opening any code. Here's our rule, and what it says about the demo.
| Pattern | Likely cause | On the demo site |
|---|---|---|
| One page type far worse than the others | Something specific to that page, usually its main image | Item pages: LCP 4.21 s against about 2.9 s elsewhere |
| The same number on every page type | Something every page shares: a script, a tag, a template | INP about 310 ms on all of them |
| FCP good, LCP late | The page starts quickly, but its main content arrives late | Item pages: FCP 1.71 s, LCP 4.21 s |
| TTFB slow | The server, hosting or cache | Not here: 634 ms, within the 800 ms we treat as good |
| CLS high on one page type | Things without reserved space appearing late | Listings: 0.17 against 0.05 elsewhere |
Which fix pays off first?
We can't give you a figure for what each one will earn. Nobody honest can before you try it. But we can give you an order. This one is our judgement, not a study. Use it as a default:
- Fix poor before amber. Poor means many visitors are having a bad time now. On the demo, that's item pages' LCP at 4.21 s.
- Then weigh by visits and closeness to a sale. Item pages have 1,086 samples, fewer than the home page's 3,605. But they're where the "Voir le numéro" and contact buttons are. They come first.
- Then pick shared causes, since one fix moves every page. INP is amber on every page type.
- Then the quick wins, such as listings' CLS at 0.17, where the fix can be as small as adding sizes to images.
What fixes each one?
Slow LCP. web.dev's guide to optimizing LCP splits it into four parts: server time, delay before the main resource starts loading, its download time, and delay before it's drawn. It suggests server time and download each take about 40%, and the two delays under 10% each. Its advice includes making the image discoverable in the first HTML, never lazy-loading it, and using fetchpriority="high" where it fits. Images in modern formats at the right size come next.
Slow INP. web.dev's INP guide divides a slow response into input delay, processing and presentation delay. Its fixes: fewer long tasks during startup, shorter event handlers, and a smaller page. Before you touch anything else, check what every page loads in common. Each extra tag you've added, including analytics, is a candidate.
High CLS. web.dev's CLS guide names four usual causes: images without dimensions, ads and embeds without reserved space, content inserted without a user action, and web fonts. For the first, add width and height to images, or reserve space with CSS.
Then check it worked, with real visits, not a lab test. Field numbers take days to weeks to move, and that delay is normal. The PageSpeed field block covers 28 days, so it changes slowly.
How MetricMind shortens this
The script collects these from real visits, as part of its roughly 12 KB, and adds them to the same record as traffic and errors.
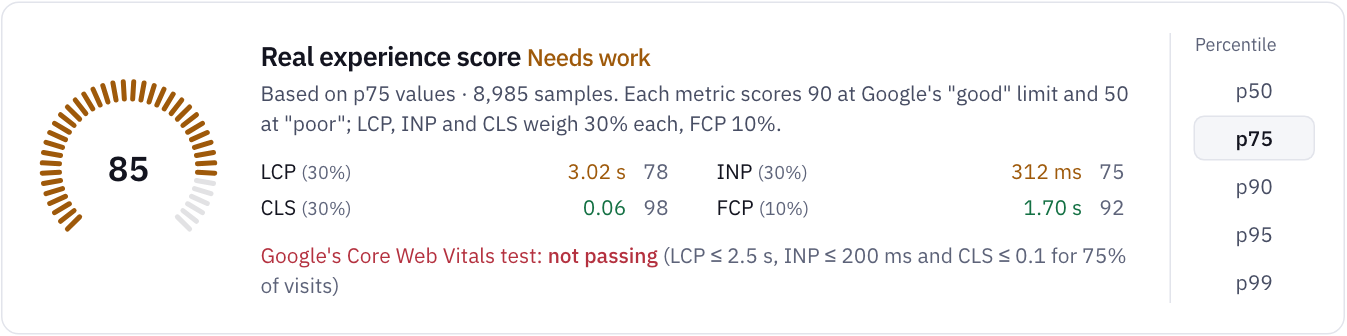
- Page types by themselves. Item pages are grouped automatically, and you can name page templates. Click a row to filter the whole page by it.
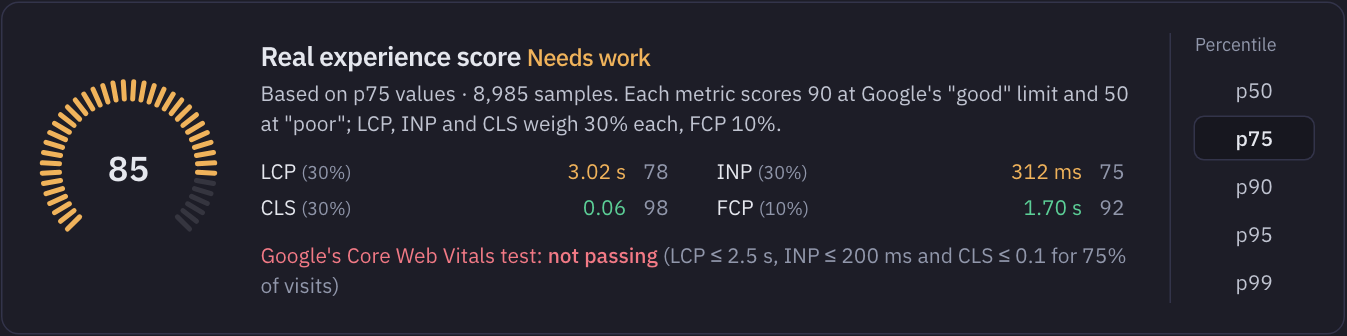
- A real experience score, 0 to 100, based on a Lighthouse-style curve: 90 at Google's good limit and 50 at its poor limit. It's our summary and not a Google metric, so Google's verdict appears next to it.
- Any percentile, from p50 to p99, and splits by country, device and browser.
- Slower page load gets flagged. A 20% rise of at least 300 ms week over week, with 50 samples each week, shows as a detected change.
- Ask the analyst which page type to fix first, with the query shown. Questions come with every plan, with a monthly allowance.
It measures what's slow, not why at the code level. For that, use the lab tools above. It can't tell you what speed is worth in contacts on your site either, though you can compare contacts before and after and judge your fix. See Web Vitals for more.
Your next step
Read Web Vitals by page type on a sample site
The live demo has real-visitor speed per page type, with the numbers used here. No sign-up.
Sources
- Google: About PageSpeed Insights
- web.dev: Web Vitals
- web.dev: Largest Contentful Paint
- web.dev: Interaction to Next Paint
- web.dev: Cumulative Layout Shift
- web.dev: Optimize Largest Contentful Paint
- web.dev: Optimize Interaction to Next Paint
- web.dev: Optimize Cumulative Layout Shift
- Chrome for Developers: Performance panel overview