What to look at in your analytics each week, in 10 minutes
By Moha Ousaid Saaid, founder · Updated · 5 min read
Each week, look at four things: how many people came compared with the week before, how many of them contacted you or bought, whether anything broke, and what they searched for. Compare full weeks only, and ignore a traffic change under about 30%. Write one line about what you found and one thing to do. If the routine produces no action for a month, ask whether you're watching the right numbers.
Why weekly, and why only 10 minutes?
Daily numbers on a small site are mostly noise. Weekdays and weekends differ, and a single post can swing a day. A full week evens that out, and it's short enough that you can still act on what you find. Monthly leaves a broken form running for weeks.
Keep it to 10 minutes so you actually do it. Open your tool on Monday, with a note beside it. Compare last Monday to Sunday with the Monday to Sunday before. Leave out today.
Minutes 0 to 2: did the size of your audience change?
Read visitors, then contacts or orders. Then decide whether the change deserves your time. These are the thresholds our own detection uses each morning. Below them, we don't treat a weekly move as news, and you can copy them.
| Number | Change of at least | And by at least | Only once the busier week reached |
|---|---|---|---|
| Visitors | 30% | 50 visitors | 100 visitors |
| Pageviews | 30% | 100 views | 200 views |
| JavaScript errors | 50% | 10 errors | 10 errors |
| Your own events | 40% | 10 events | 20 events |
| A goal's conversions | 40% | 5 conversions | 15 conversions |
| Frustrated visits | 50% | 8 visits | 10 visits |
These are our choices, not laws of nature. They're there to stop you reacting to a change smaller than a site's ordinary wobble, and you can tighten them once you know your own numbers.
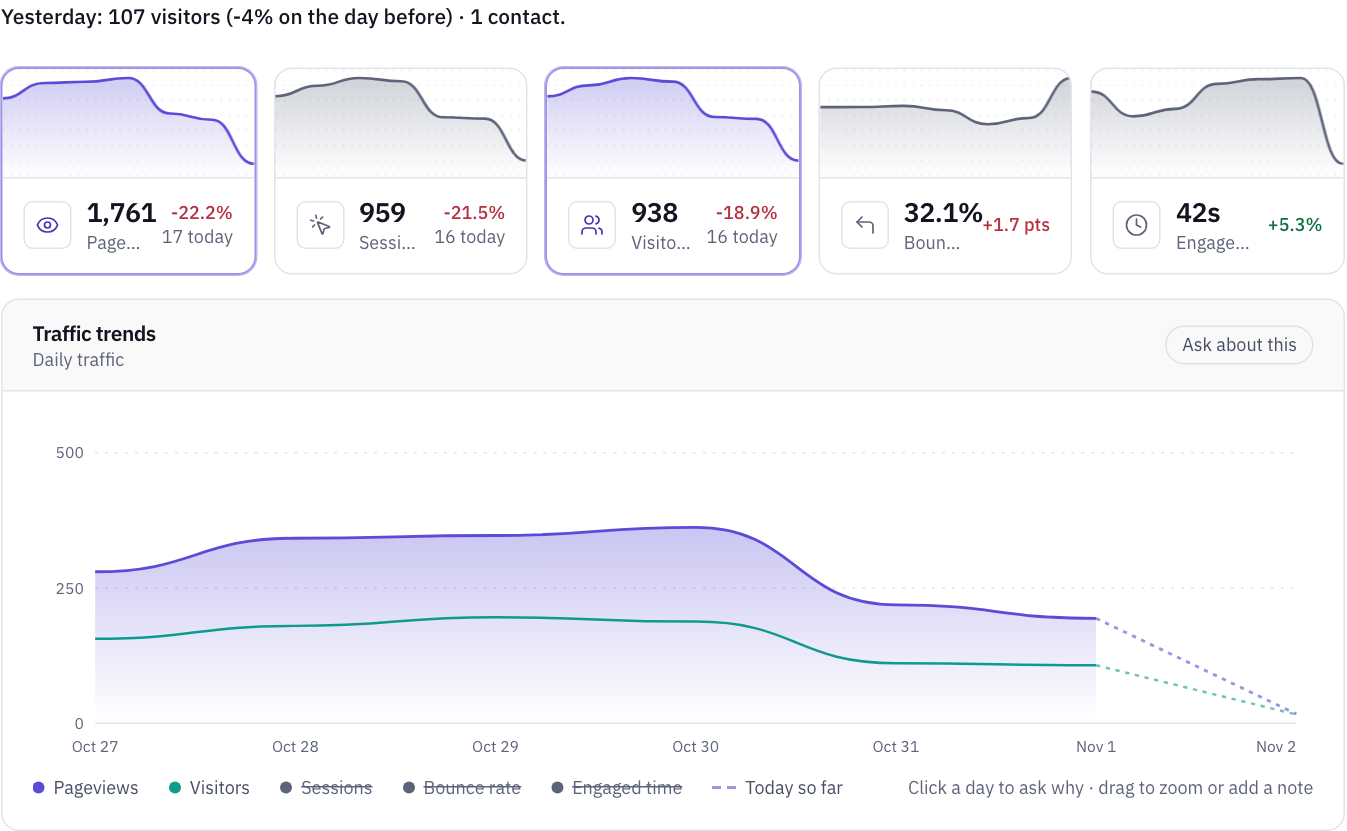
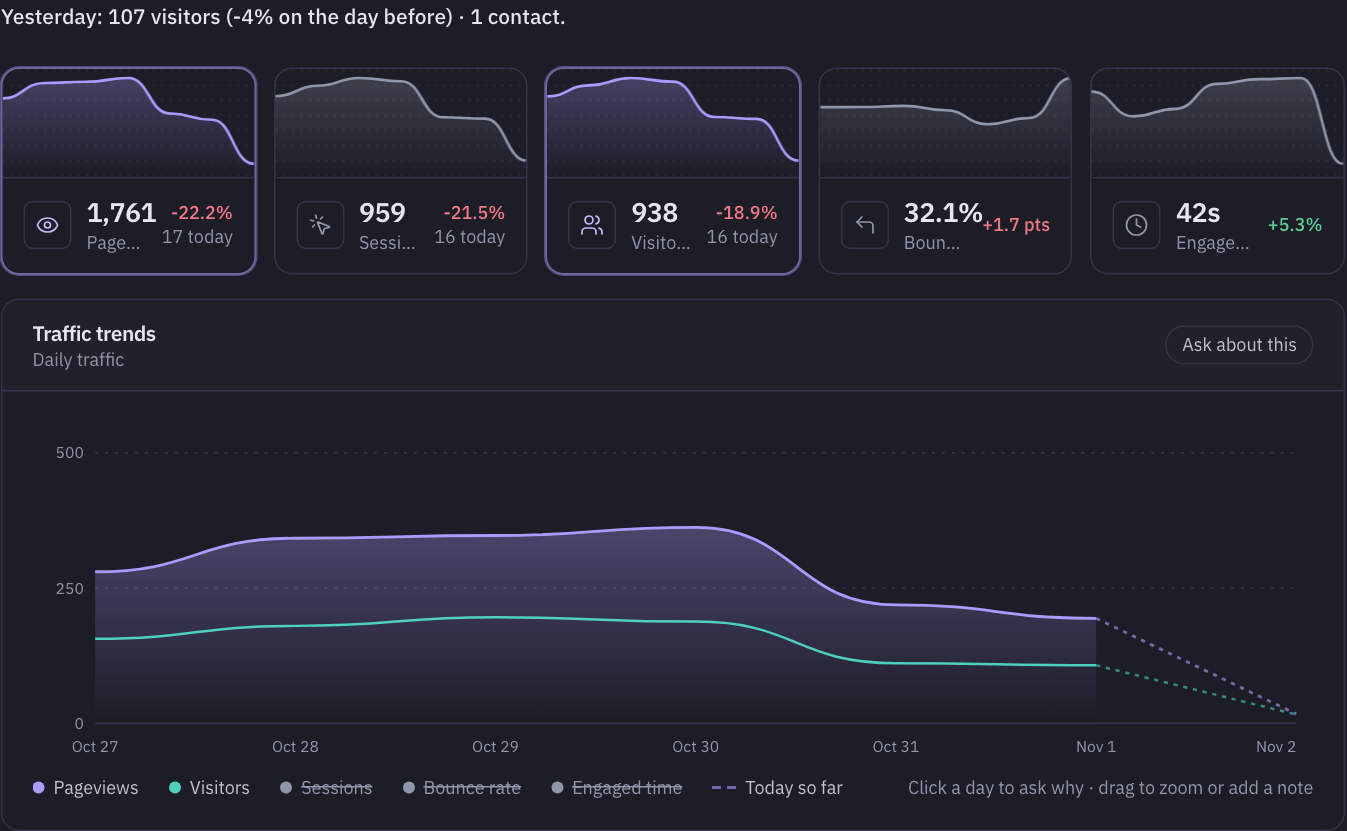
Here's a worked example. Our demo marketplace's dashboard shows visitors down 18.9%, in red. Should you worry? Using complete weeks, 26 October to 1 November had 1,128 visitors against 1,395 the week before, which is a fall of 19%. That's under the 30% line. And the week before held a launch day with 466 visitors. If that Friday had been an ordinary 180, the earlier week would have had 1,109, and this week would be up 2%. Nothing is wrong. The red number was last week's spike going away.
So when a number is red, first ask what was unusual about the week you're comparing against. If one day looks strange, run the same-kind-of-day test.
Minutes 2 to 4: where did they come from?
Only if something crossed a line, split it by source. Compare the change in visitors per source, not the percentage. If nothing crossed a line, glance at the top five sources and move on.
If Google matters to you, open Search Console's Performance report for clicks and queries. It marks its newest data as preliminary, so judge complete days. Google also says small fluctuations in position can happen at any time, and warns against radical changes when a page is already doing well.
Minutes 4 to 6: did anyone do what you wanted?
This is the part that pays. For sites without a checkout, count taps on phone and WhatsApp links plus forms sent, then divide by visits. For a shop, use orders. Write the number down each week, in one column of a spreadsheet. Six weeks later, you have the only benchmark that counts: your own.
If it fell while visitors held steady, that's the week's most important finding. Check that the action still works, by tapping your own phone link and sending your own form.
Minutes 6 to 8: did anything break?
- Errors: anything new on a key page, especially after a release.
- Frustrated clicks: rage clicks and dead clicks, if your tool has them. Compare with last week's page list.
- Downtime: did your monitor report anything? If you don't have one, set one up.
- Your own check: open your site on your phone, on mobile data, and go through to contact or checkout. It takes one minute, and it catches what numbers don't.
Minutes 8 to 9: what were people looking for?
Read your site search terms. Look for anything new, or for terms that found nothing. If you have no search box, look at your most-visited pages for a surprise: an old article suddenly bringing people, for example.
Minute 10: write one line and one action
One line, in a running note, such as: "Week to 1 Nov: visitors 1,128, down 19% against launch week, so ignore. Find out why people leave after searching velo electrique." And one thing to do this week, or "nothing", which is a fine answer.
Don't change anything that week unless something crossed a line or broke. Changing things every week is how you end up unable to tell whether any of them helped.
What can you skip?
| Number | Why skip it | When it matters |
|---|---|---|
| Bounce rate | It moves with your traffic mix | When one landing page changes sharply |
| Time on site | It rarely leads to a decision | When a page exists to be read |
| Country list | It rarely changes | Monthly, or if one country falls |
| Browser and device split | It rarely changes | When errors or speed differ on one of them |
| Web Vitals | They move slowly | Monthly, per page type |
How MetricMind shortens this
- A Monday digest of the previous Monday to Sunday can go to Slack, a webhook or email. So can a plain weekly or monthly report, to anyone, with no account needed.
- A one-line summary of yesterday sits at the top of each dashboard, along with visits sorted into converted, frustrated and bounced.
- The thresholds above run every morning. Detected changes are listed on every plan, and normal swings stay quiet. You can also set an alert such as "tell me when contacts go below 2 a day".
- Ask the analyst "what changed last week?" and read the query behind its answer. Questions come with every plan, with a monthly allowance. Written investigations start with Pro. Scheduled questions come with Business and Scale.
- The board keeps the cards you read each week in one place, re-run live for the dates you choose.
It can't look at your phone log or your inbox, so the one-minute check stays yours. It doesn't have Search Console data yet, either. See what the analyst does for the rest.
Your next step
Try the routine on a sample site
The live demo has every panel in this routine, filled with sample data. No sign-up.